Jan 29, 2025
Organize Your Expressions in a Dedicated DAX Table
Philip Wiest, Guest Blogger

Want to be more organized? One step you can take is to tidy up your explicit measures in Power BI Desktop and Power Pivot by organizing them in a separate table.
A dedicated DAX Table offers three key benefits:
- Improves organization — grouping all your DAX measure under one table makes your model easier to navigate, especially if your data model includes multiple tables.
- Aligns with semantic modeling best practices — this setup separates calculations (measures) from raw data, allowing for clean, easy-to-maintain models.
- Enhances productivity — you can quickly find and edit DAX measures without searching through multiple tables.
In Power BI Desktop and Power Pivot, the foundation of an effective semantic model lies in its organization and clarity. What’s the secret?
Calculated Tables Viewed in Power BI Desktop
Calculated tables — tables explicitly designed to house DAX expressions — are an essential tool for ensuring your model is both functional and maintainable. Whether you're using the Power Query’s “Enter Data” feature, or the New Table command in Power BI Desktop, mastering the creation of these tables is a key skill for any professional.
Why use a dedicated table?
Without a dedicated table, it’s easy to lose sight of DAX calculations scattered across multiple existing tables in your model. The result is a disorganized structure that complicates troubleshooting and collaboration.
By centralizing calculations in a dedicated table, you ensure better transparency, easier debugging and enhanced scalability. This practice transforms your model into a powerful, well-structured asset that supports not just your current needs but also future development.
Learn more in one of our live upcoming public training sessions:
Accelerated Power BI for Beginners
Excel Power Tools: Power Query and Power Pivot
Your step-by-step guide to creating a dedicated table
For Power BI Desktop:
To create an empty table named “DAX Table” with a single column and a placeholder value.
- Go to the Modeling tab in Power BI Desktop.
- Click on New Table.
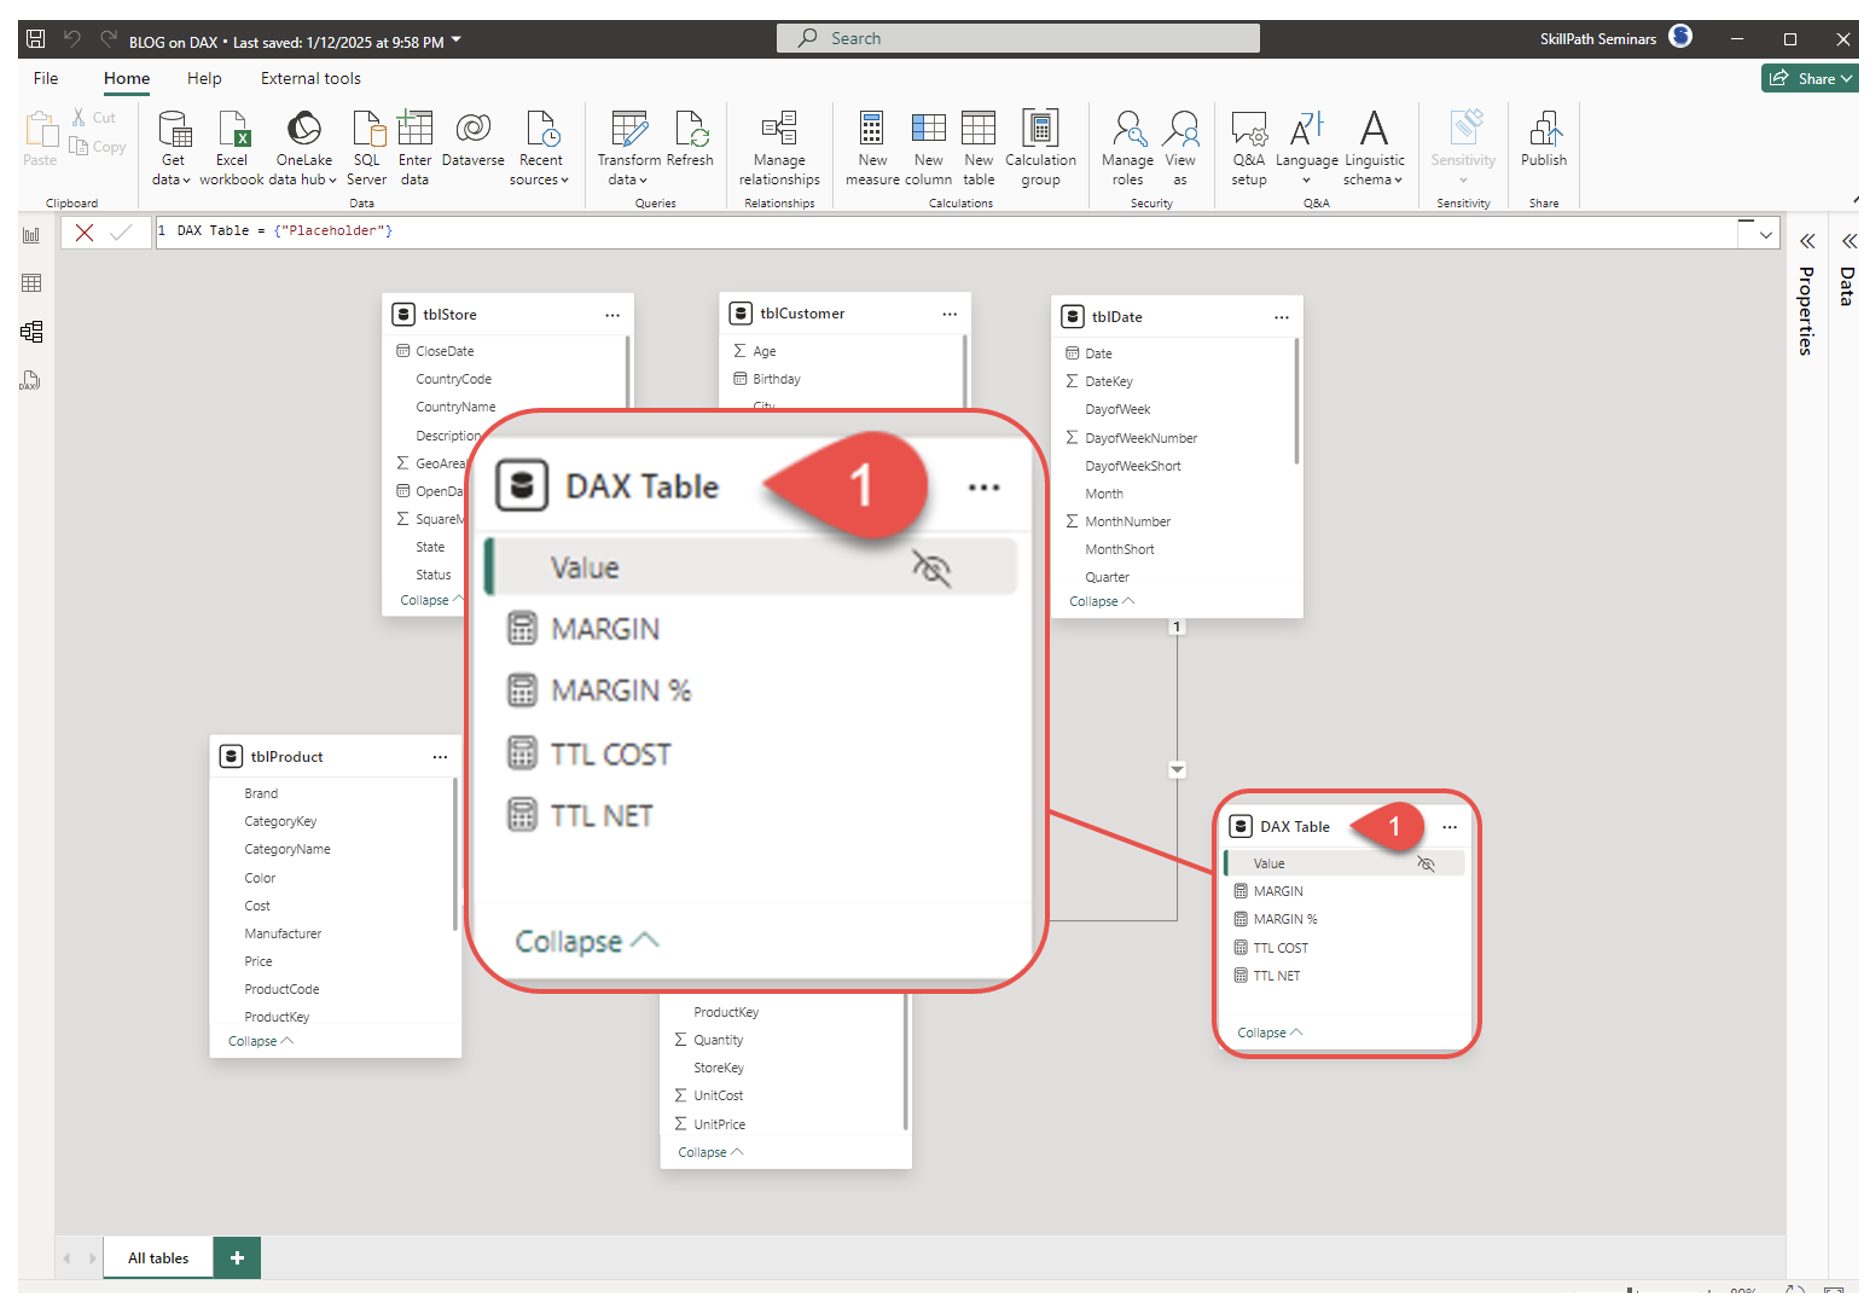
- In the formula bar, type a DAX expression like this to create an empty placeholder table:
DAX Expression Table = {"Placeholder"} - Now, you have an empty table.
- Add Measures to the DAX Expression Table.
- Select the new table (DAX Table) in the Fields pane.
- In the ribbon, go to Modeling and click New Measure.
- Create measures you need and assign them to the DAX Table.
Here are examples of the expressions we created:
| MARGIN | = CALCULATE([TTL NET]-[TTL COST]) |
| MARGIN % | = DIVIDE([MARGIN],[TTL NET]) |
| TTL COST | = SUMX(tblSales,tblSales[Quantity]*tblSales[UnitCost]) |
| TTL NET | = SUMX(tblSales,tblSales[NetPrice]*tblSales[Quantity]) |
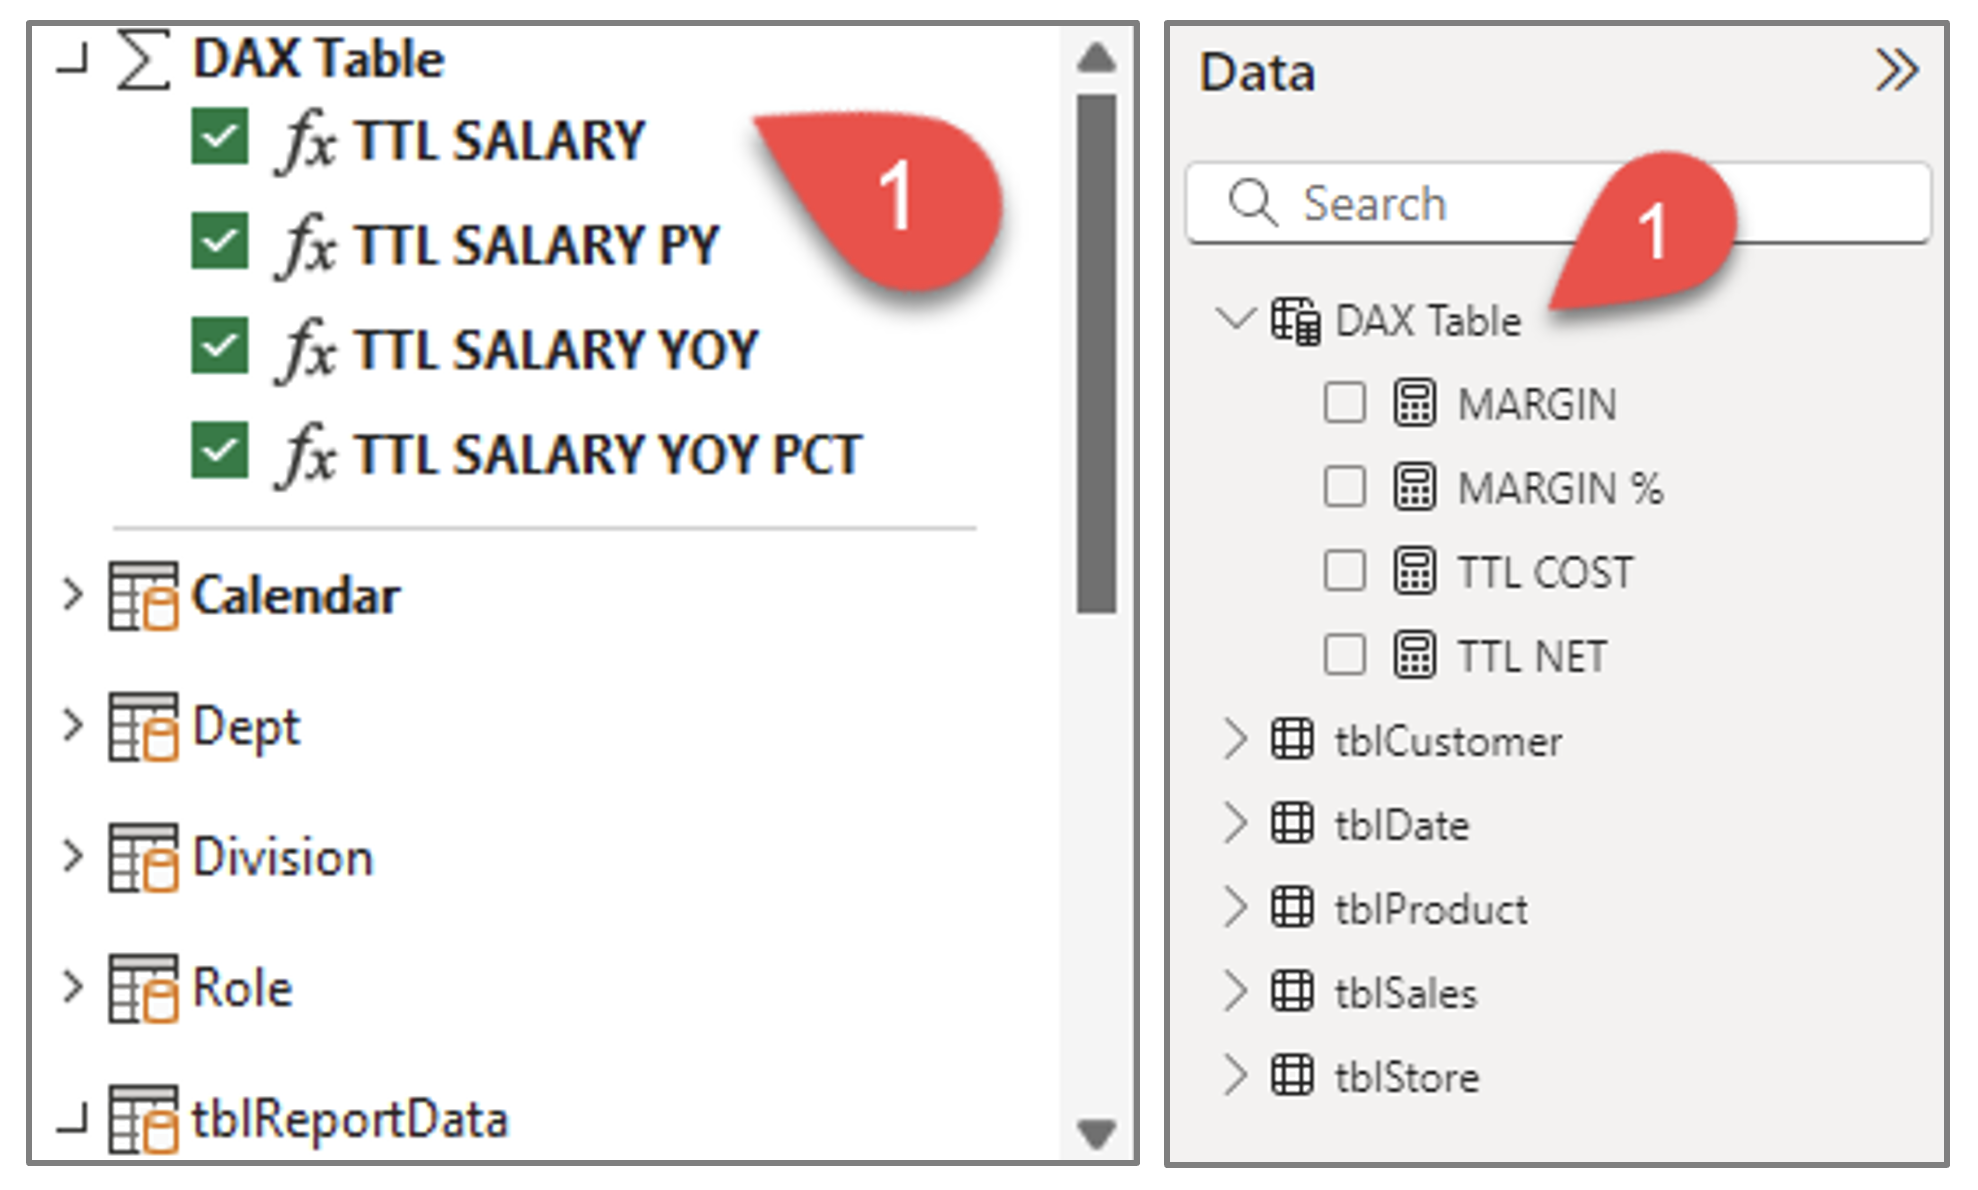
Here is what the measures look like in their own calculated DAX Table (the result in PowerBI Desktop):
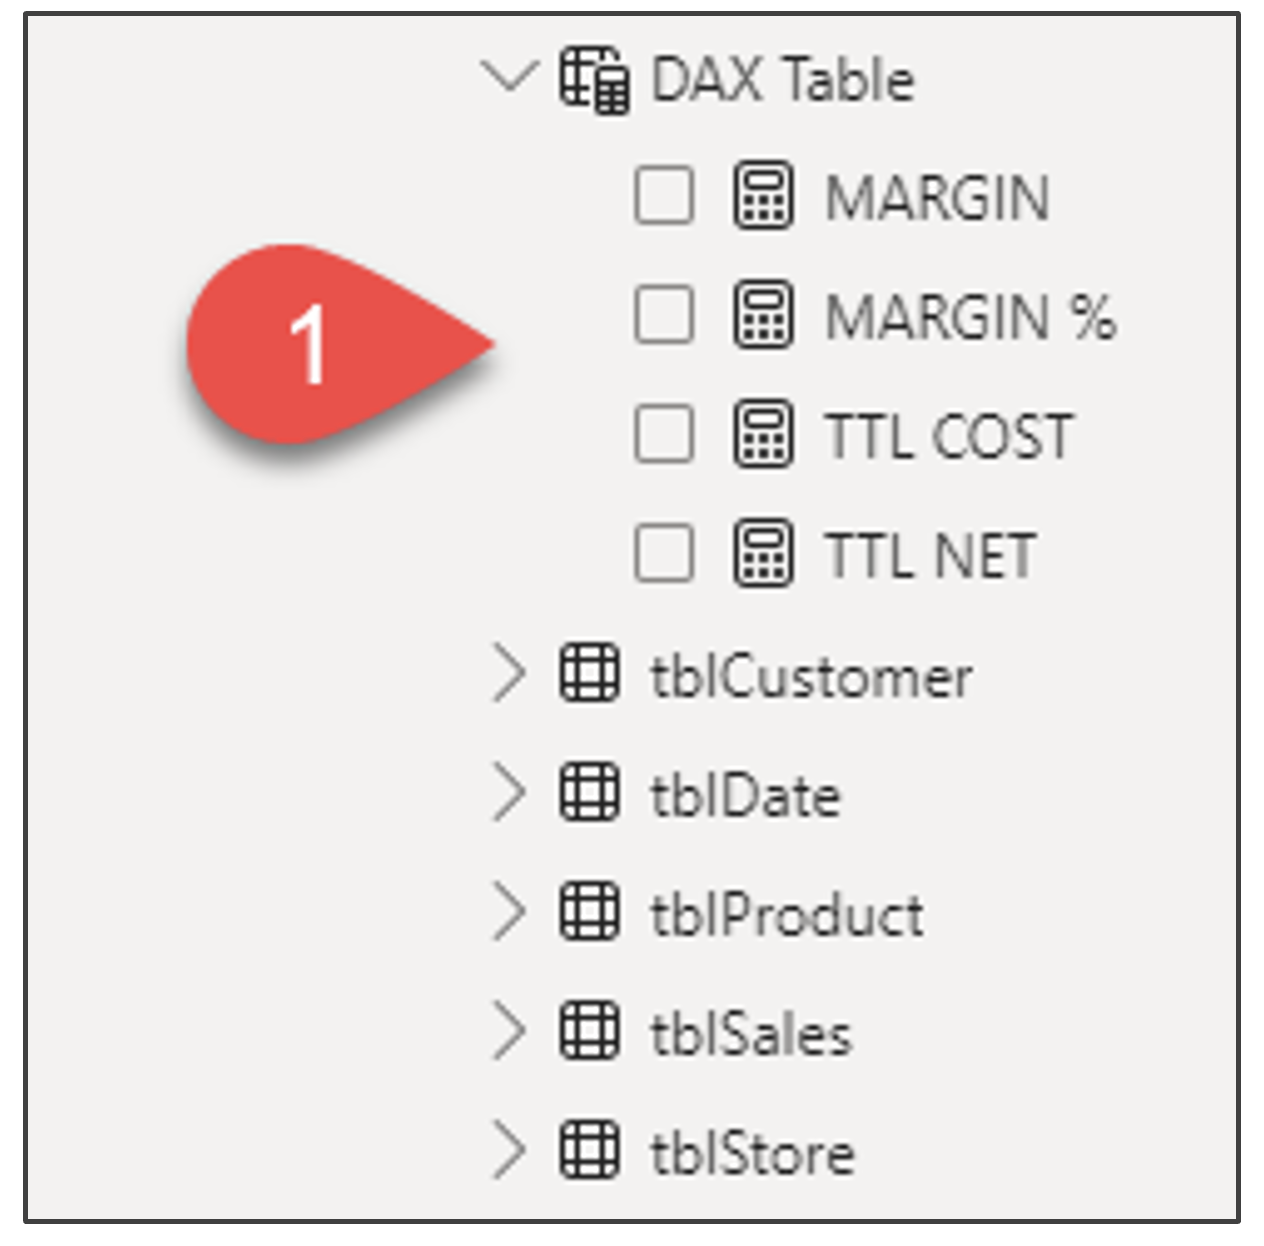
And when it comes time to build your report, here’s what you will see in the Data pane:
That’s the secret to how PowerBI developers organize their expressions.
For Power Pivot:
The secret to building a calculated table in Power Pivot is to build it in Power Query — because it’s easier!
In Power Query,
- Go to Data > Get Data > Launch Power Query Editor.
Click Enter Data in Power Query.
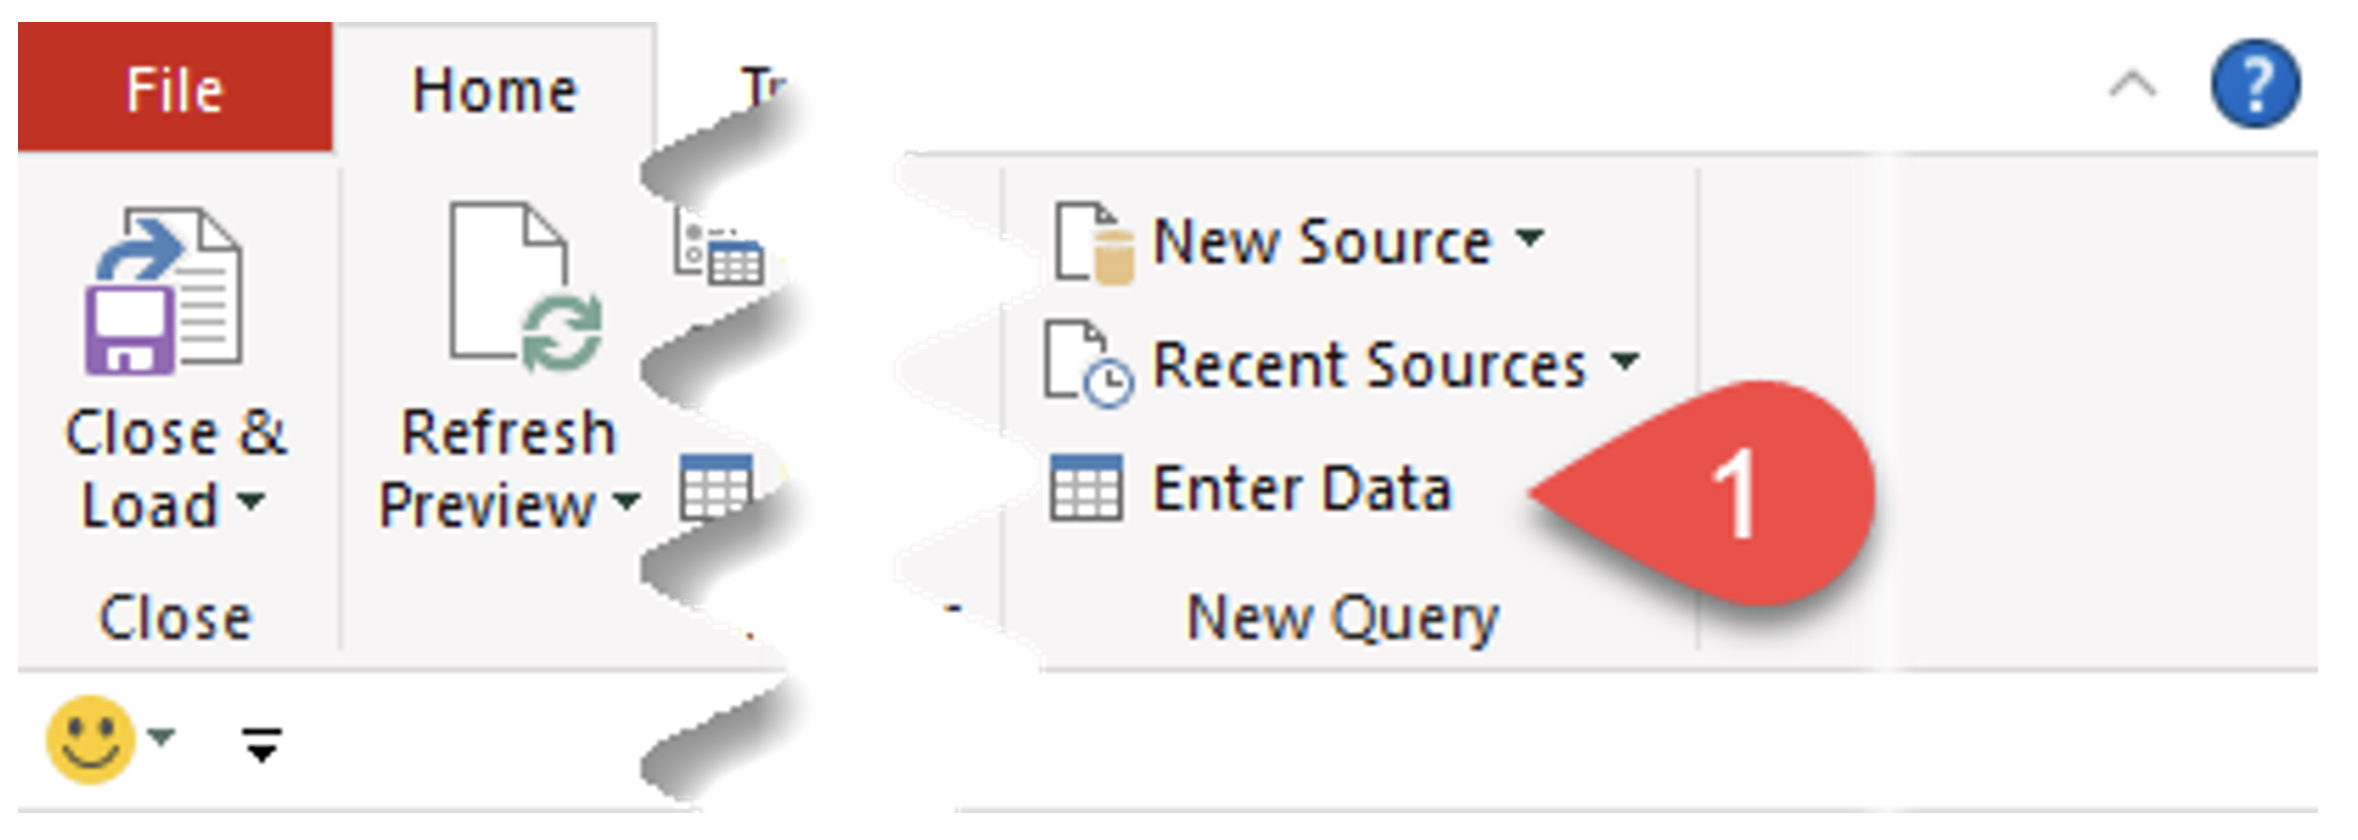
Create a single-column table with headers and one placeholder row (or leave it empty):
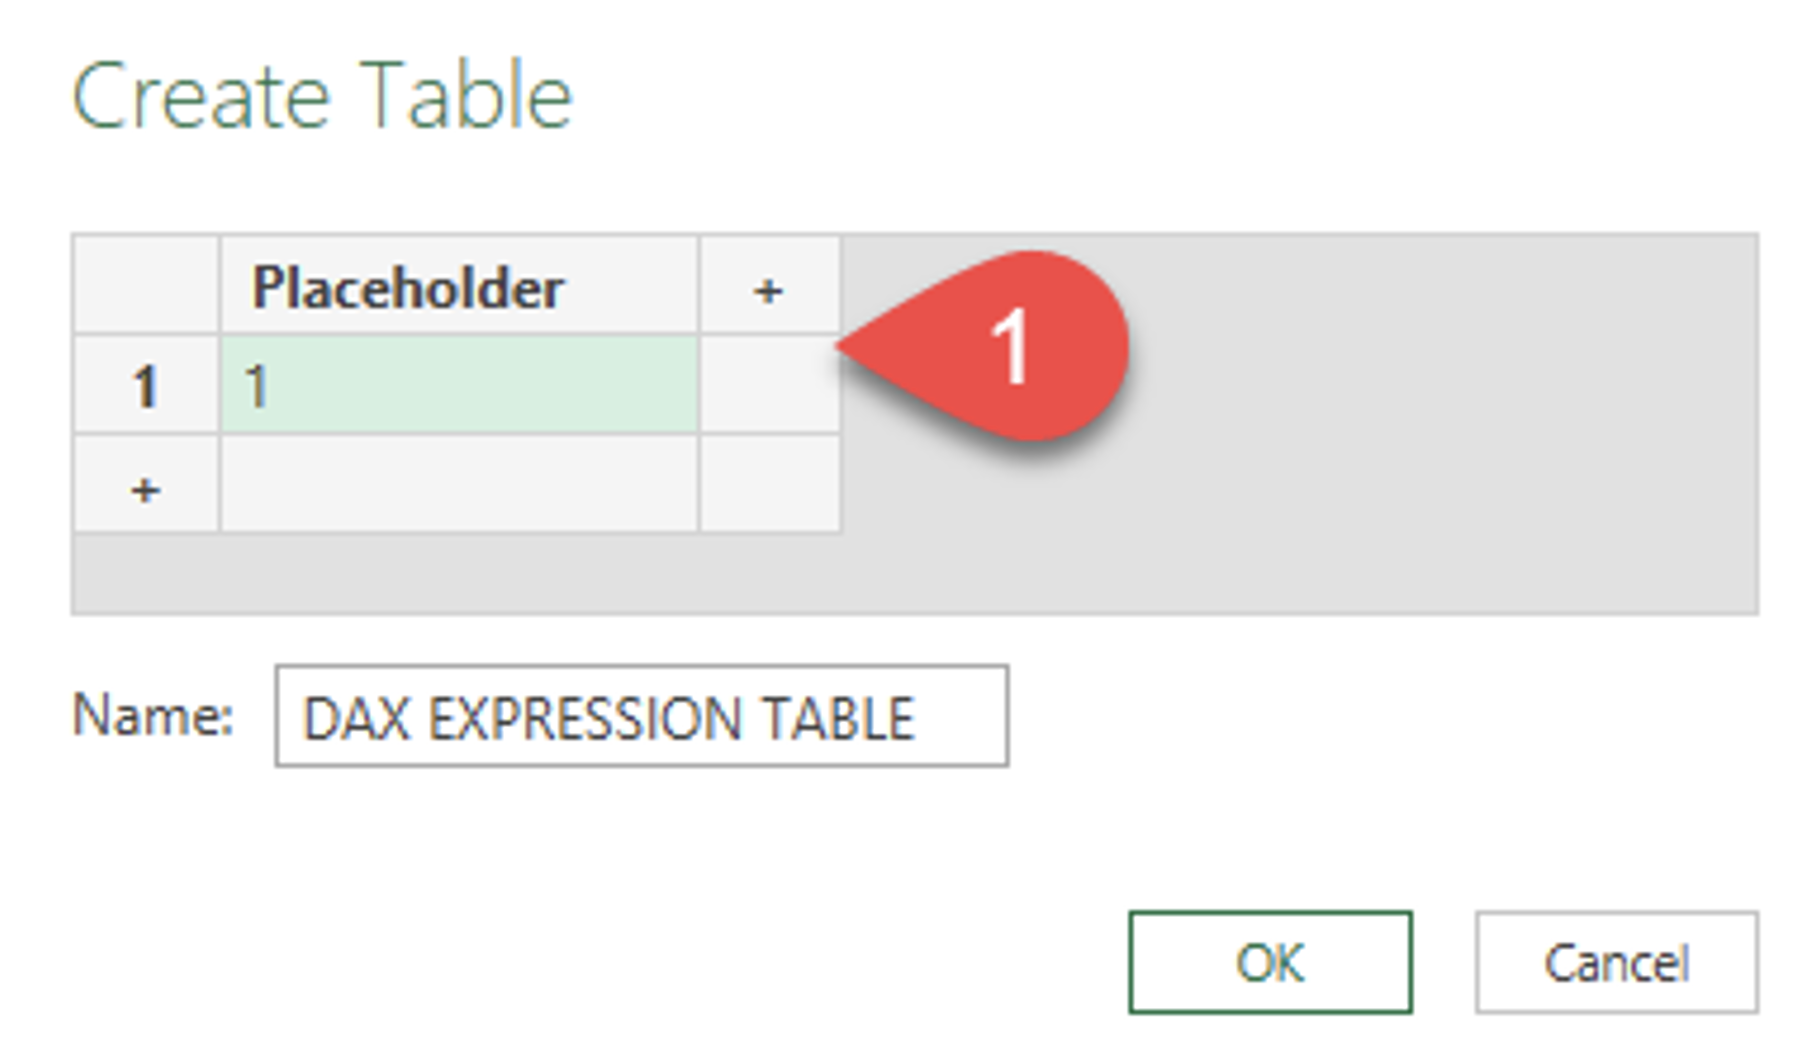
- Name the table (e.g., DAX Table).
- Load it to the Data Model: Click Close & Load To... and choose Only Create Connection and check Add to Data Model.
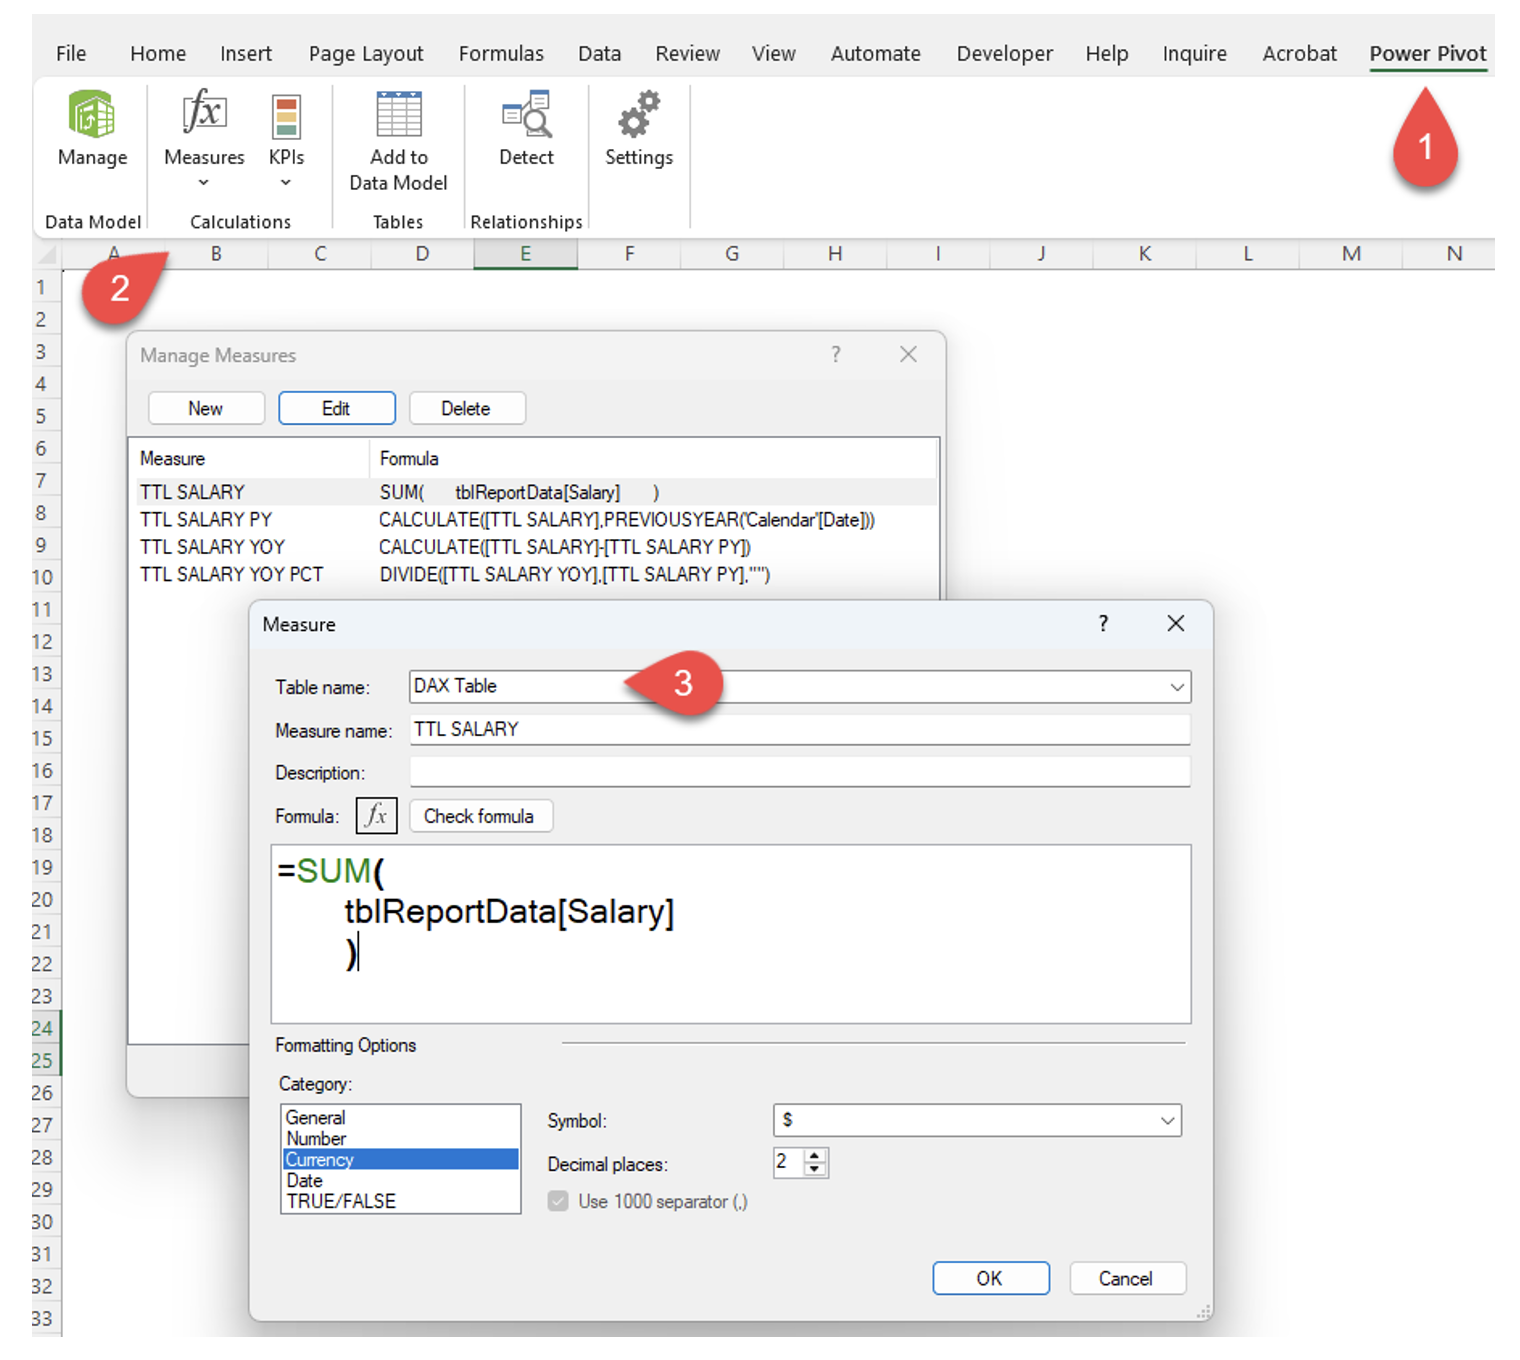
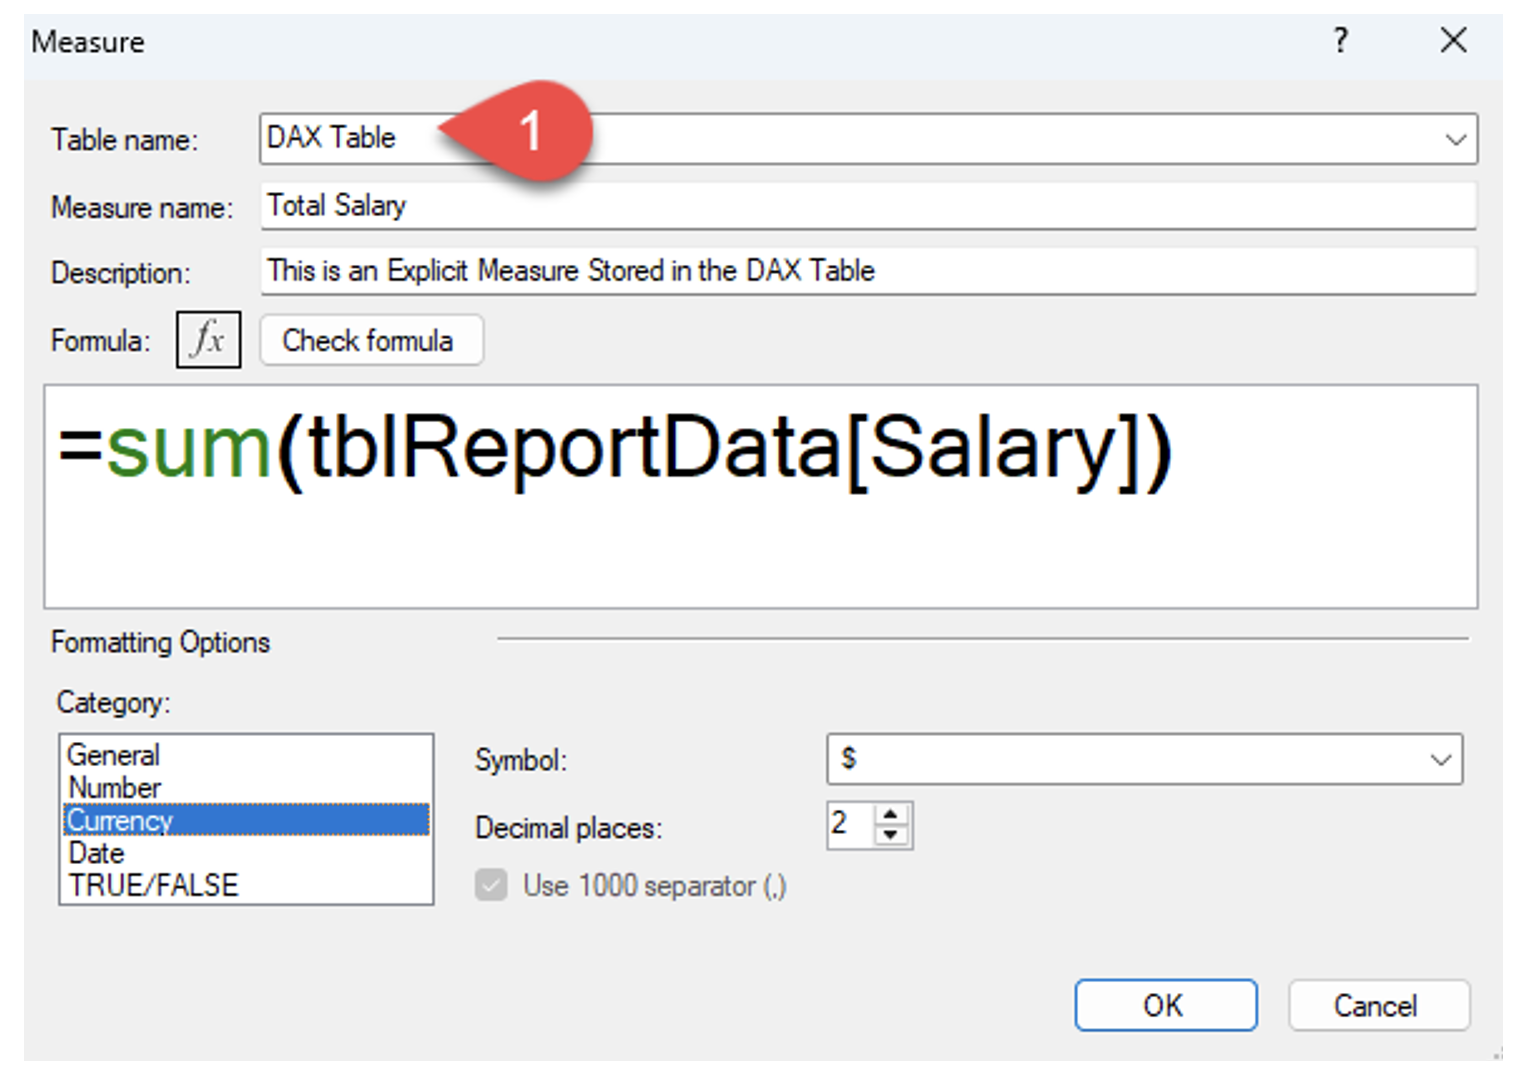
- Assign DAX Expressions to the table in Power Pivot.
To manage your measures in Power Pivot — Power Pivot > Calculations > Measures > Manage Measures.
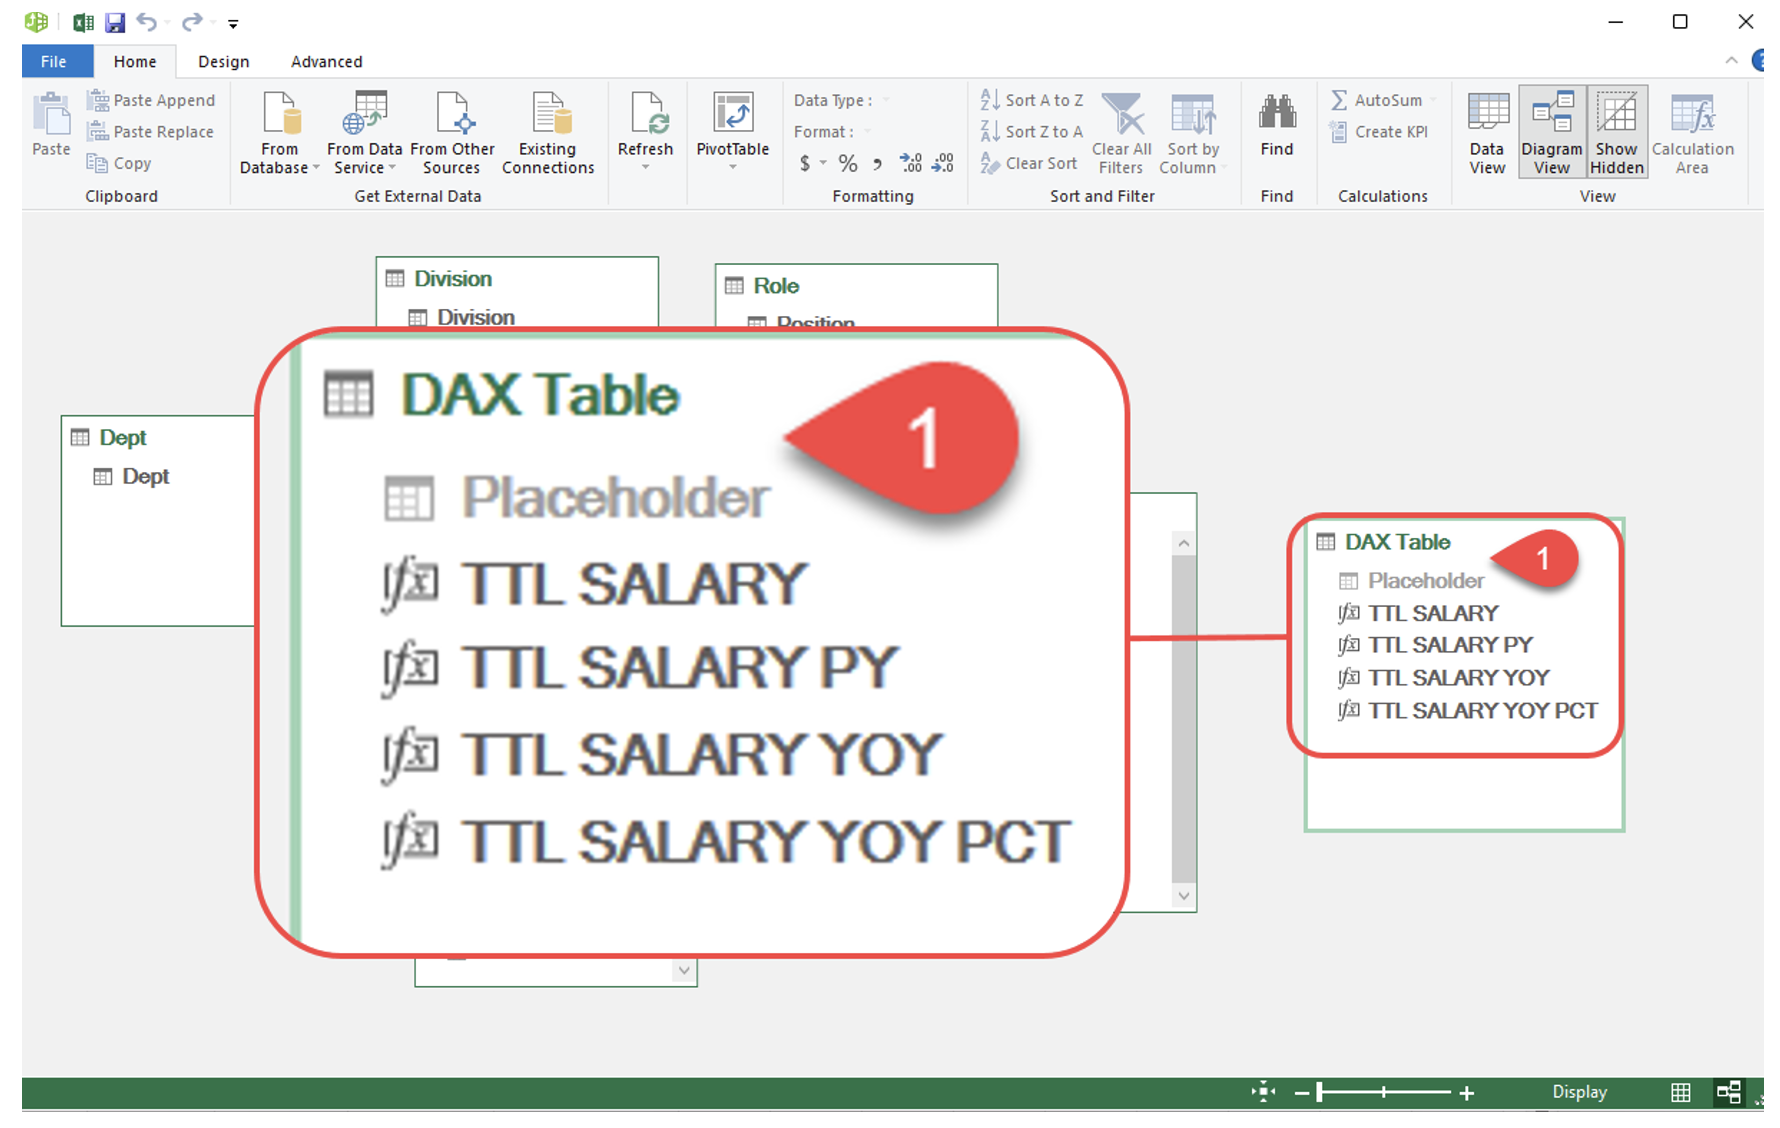
Now, isn’t this a more organized way to set the table?
Don’t be haphazard!
Philip Wiest
Guest Blogger
Philip Wiest is an expert software trainer, computer analyst and database consultant who knows both the intricacies of computer systems and the ways today’s professionals need to use these essential business tools. Using his experience in Microsoft Excel and Microsoft Office, as well as Windows and the Internet, Phil uses a special mix of tactful guidance and distilled observation so his audiences learn and retain the critical keystrokes, application combinations and creative processes that save time and simplify computer use.
Latest Articles
Article Topics